
Introduction
Welcome back to part three of our E/W trade review, where we invite you to explore the relationship between old and new alliances and how this rocky hand-over period will shape the future of container shipping in 2025 on the Far East - Europe trade.
We kick off this analysis with the knowledge that many service versions have already begun, but it will still be a couple of weeks before many of these maiden voyages on Gemini Cooperation and Premier Alliance services reach their first ports of discharge on the Northern European and Mediterranean shores.
While there have been no shortage of schedule reliability obstacles on all E/W trades these past few months, Asia - Europe services were uniquely positioned to contend with extensive rotation adjustments due to the Red Sea crisis. Whether or not we will have another round of changes to the new status quo with a shift back towards the Suez Canal passage in the months ahead could be a majorly defining factor in how trade capacity shifts and schedule reliability evolves for the new alliances.
Key takeaways
-
The characteristic slump in expected/proforma capacity that we’ve seen across all E/W trades during the handover is extended by an additional 2 weeks in FE-EU and rolls throughout April due to longer transit times.
-
MSC will enjoy continued alliance support in the FE-EUR trade, unlike FE-NA, but their alliance-level capacity representation will fall by 28% in their new partnership with Premier Alliance.
-
Strategic blank sailings and the blanket pushback of several Premier service start dates just prior to their commencement contributes to improved reliability in first sailings.
-
The longer roundtrip times and large number of European and Mediterranean ports leave much room for rotation alterations in the new alliance iterations of old services, making it even harder to pin down old vs. new services that effectively ‘mirror’ one another.
Services overview
A brief overview of the total number of services represented pre and post-transition by each alliance category in the Northern Europe and Mediterranean subtrades.
Far East - Northern Europe
- OCEAN Alliance - 6 vs. 7 services
- 2M Alliance - 5 vs. 0 services
- THE Alliance - 4 vs. 0 services
- Gemini Cooperation - 0 vs. 4 services
- Premier Alliance - 0 to 6 services
- Non-Alliance - 11 vs. 12 services
Maersk Line will see a decrease of 1 service offering while Hapag Lloyd will continue to participate in a total of 4. OCEAN alliance partners will see an increase of 1 service with the late addition of the NEU3 in April, which is yet to be confirmed by all participating carrier schedules.
Far East - Mediterranean
- OCEAN Alliance - 5 vs. 5 services
- 2M Alliance - 5 vs 0 services
- THE Alliance - 5 vs. 0 services
- Gemini Cooperation - 0 vs. 6 services
- Premier Alliance - 0 vs. 6 services
- Non-Alliance - 11 vs. 13 services
On the Far East - Mediterranean trade, new alliance partners will see the total number of services increase from 5 to 6. While there will be an uptick of 3 active services in the non-alliance category, irregular services like the 43 day frequency TRANSIT - Fetled Express or the 14 day TWSL - PAX mean that the average number of 6 weekly calls remains the same in both regions.
Trade capacity evolution during transitions
Two major factors that contribute to the proforma capacity slump observed in February on all E/W trades are the alignment between the early Lunar New Year and alliance transitions, and the fact that there is no hard cut-off for end/start dates across old and new alliance services. This means that there are long periods of lull in planned sailings where a service like The Alliance’s MD3 will have sailings into its first port of discharge suspended by week 10, but arrivals on Premier Alliance’s MD3 are not planned to arrive until week 14. This is not taking into account any actual delays that would be accrued and built into live forecasts along the way.
Alliance transitions coinciding with the Lunar New Year mean that while blank sailings are used for both strategic purposes like offsetting delays on first voyages, they also allow carriers to suspend some services ‘early’ instead of inserting blanks as they usually would in the corresponding holiday weeks in January or February. You can read more about this phenomenon and its impact on capacity in the Far East - West Coast North America analysis, our analysis of the PMR - PS3, or in the recent article by our friends at Journal of Commerce.
Trade lane overview - monthly

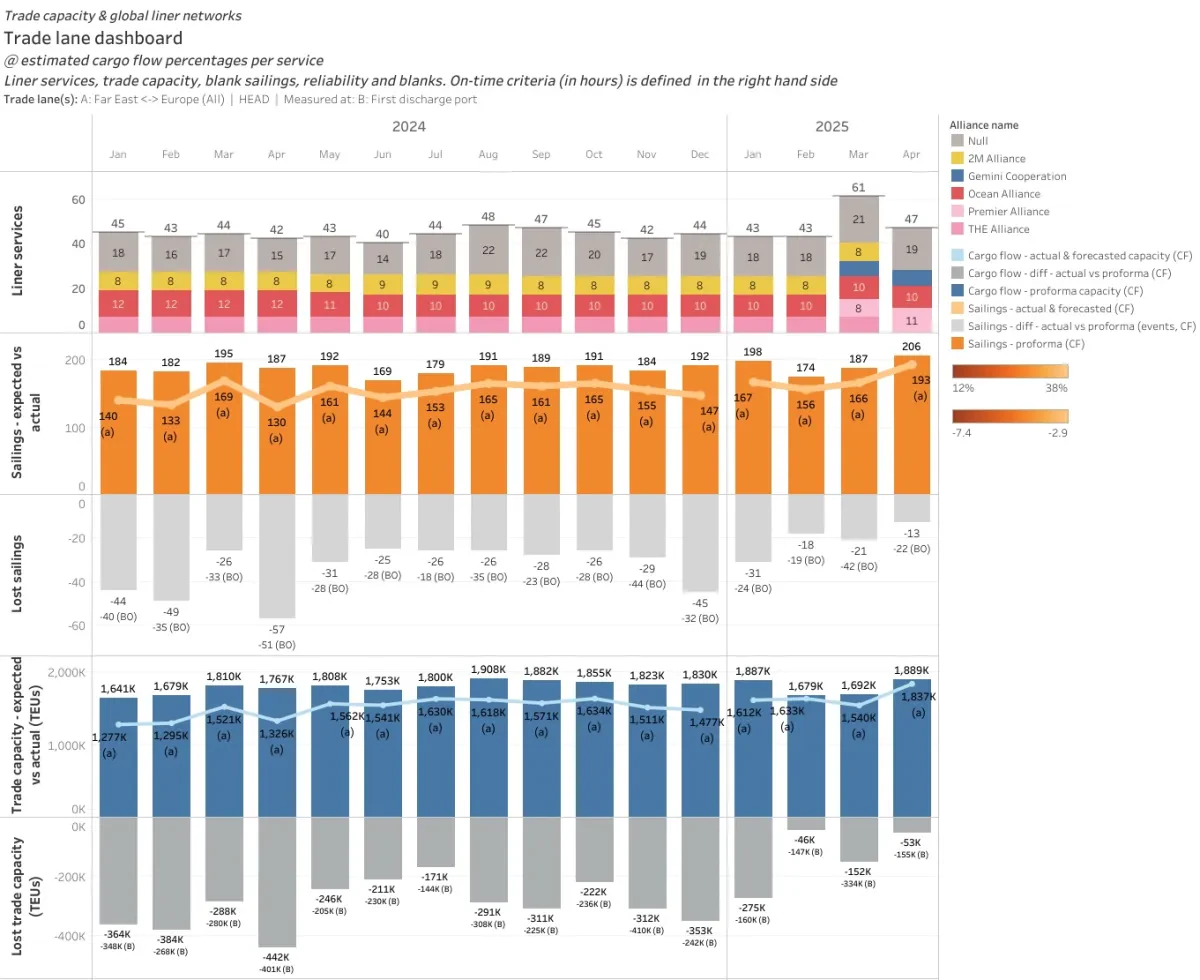
A look at the monthly progression of the transition period shows us the expected spike in total unique service versions available throughout the month of March, all the way up to 61 from 43. This is tempered by the weekly reality of no more than 38 active service versions at any given time, as observed below. There is also a drastic slump in planned sailings from 198 in January down to 174 in February and 187 in March, a distinctly longer handover period than what we observed in the Far East - North America trade analysis. Planned capacity in February and March averages out at 1,686K TEUs before climbing back to 1,889K TEUs in April and becoming aligned with proforma capacity trends upheld since August 2024.
Trade lane overview - weekly

The weekly view of our Trade Capacity Index most effectively illustrates the longer transition period for these services. This extended handover is especially true in the case of The Alliance to Premier transitions, which will take 5 full weeks from weeks 11 through 16 to achieve regularity in planned sailings. The fact that we are talking about planned capacity impact on the head haul means extra consideration needs to be taken into account for actual forecasted capacity in the context of accrued delays. The earliest start date for a Premier service into Northern Europe is the pendulum FP1 on week 12, beginning with the NYK VENUS which is currently forecasted with a -7 day delayed arrival into Rotterdam on March 27. Given that her proforma arrival date of March 20 and her forecasted arrival are well over a month out, it wouldn’t be unusual to see her first voyage into Rotterdam on the FP1 delayed by a 10 days or more.
Trade capacity evolution by alliance
Changes to expected average weekly trade capacity in the sections below are split by subtrade in order to provide more clarity in capacity distribution by cargo flow. We have defined the pre-transition and transition period as October 28, 2024 - March 16, 2025 and March 17, 2025 - May 04, 2025; a total of 27 weeks/6 months.
Far East - Northern Europe
- OCEAN Alliance - 6 sailings/wk @94K TEUs total vs. 6 sailings/wk @ 94K TEUs total
- 2M Alliance - 5 sailings/wk @70K TEUs total vs. full suspension
- THE Alliance - 4 sailings/wk @52K TEUs total vs. full suspension
- Gemini Cooperation - non-existent vs. 4 sailings/wk @40K TEUs total
- Premier Alliance - non-existent vs. 5 sailings/wk @59K TEUs total
- Non-Alliance - 6 sailings/wk @33K TEUs total vs. 6 sailings/wk @28K TEUs total
Trade capacity index for Far East - Northern Europe - monthly

Far East - Mediterranean
- OCEAN Alliance - 5 sailings/wk @49K TEUs total vs. 5 sailings/wk @ 50K TEUs total
- 2M Alliance - 5 sailings/wk @49K TEUs total vs. full suspension
- THE Alliance - 5 sailings/wk @39K TEUs total vs. full suspension
- Gemini Cooperation - non-existent vs. 6 sailings/wk @38K TEUs total
- Premier Alliance - non-existent vs. 4 sailings/wk @51K TEUs total
- Non-Alliance - 8 sailings/wk @33K TEUs total vs. 8 sailings/wk @40K TEUs total
Trade capacity index for Far East - Mediterranean - monthly

Despite 2 less weekly sailings into Northern Europe, Gemini Cooperation will provide fairly equal representation on both subtrades in terms of proforma capacity. The Premier Alliance on the other hand, will have a bit more impact in Northern Europe, with 59K vs. 51K average weekly TEU’s deliverable. OCEAN alliance sees little to no change in its aggregate proforma capacity representation across both regions.
Although there will be little change in the total number of planned sailings, the Far East - Mediterranean subtrade will see a increase in both alliance and non-alliance weekly capacity, at 1% and 18% increase respectively. Northern European ports on the other hand will see a decrease of 11% on alliance offerings and 15% in non-alliance service capacity. It will be interesting to see how this shift settles given the possibility of regular sailings through the Suez Canal in the Q3 or Q4 of 2025. With the positive uptick in schedule reliability noted on the Mediterranean trade in our Q4 2024 Schedule Reliability Scorecard (SRS) publication, a return to more predictable and shorter routings, as well as a shift in first ports of discharge, could spell a significant comeback for the region.
If we take a little dive into how carriers' new alliance participations affect their former vs. upcoming capacity representation: MSC takes a 28% loss in the 2M to Premier transition, from 119K to 85K weekly TEU’s across both Mediterranean and Northern Europe trades. For Maersk Line, the shift sees a 35% loss in capacity from their 2M to Gemini partnership with a weekly difference of -41K TEU in proforma sailings. Hapag Lloyd’s shift into Gemini Cooperation sees a less pronounced dilution of alliance-level capacity offered with just 14% decline from 91K to 78K weekly TEU’s across both trades. The remaining THEA partners HMM, ONE, and YML achieve a 17% increase with an additional 19K TEUs in their weekly alliance sailings.
Please note that 2M’s NEUR loop 2 and loop 4 which call both the Mediterranean and Northern Europe subtrade are accurately represented by their prorated cargo flows. In other words, their proforma capacity impact is not being doubled but counted according to the estimated percentage of nominal capacity delivered to first ports of discharge on each cargo leg. The Alliance’s FE2 and FE4, and OCEAN Alliance’s NEU4 service also fall into the same category. The NEU4 service for example, calls transhipment hub Tangier Med prior to its primary port of discharge in France, Le Havre. This head haul cargo flow ‘split’ is represented by an estimated 2K TEU of average weekly capacity into Tanger and 9K TEU into Le Havre.
MSC's non-alliance offerings
Our analysis of MSC’s non-alliance representation really differs on this E/W trade because they do participate heavily in the upcoming Premier Alliance. It’s just the PMR - FP1 pendulum service where they are not participating with ONE, YML, & HMM. That said, there are still a handful of noteworthy standalone services that will be offered by MSC in Far East - Europe. The standalone services Dragon and the Swan-Sentosa pendulum will both be suspended in May, while the Phoenix, Jade, and Albatros all commence their first sailings in February.
While not as dramatic as their dominance of the non-alliance sector in the Far East - North America trade, the carrier will manage to increase their offering in Europe as well. If we include MSC’s ongoing participation on the AES service - where they partner with ANL, APL, and CMA - and the continuation of their standalone Britannia service, the difference in their pre and post-transition non-alliance service capacity is 37K vs. 43K TEU’s, a 14% increase.
Service examples: schedule outliers
While our capacity analysis reveals that we must expect an additional accrual of delay on all E/W trades for vessels embarking on their first voyages on new alliances, the new Far East - Europe rotations currently reveal little to no delay in their first sailings, excepting pendulum services. Final adjustments with major impact on these potential delays were observed in January on the new standalone MSC services and Premier Alliance rotations, most notably the delay in maiden voyage profroma dates for 5 Premier services.
Another consideration unique to this trade is that many versions were originally rolled out with both Cape of Good Hope and Suez Canal options last year. The canal-centric routes in our database were binned before the beginning of 2025 when it became clear to eeSea analysts that carriers would not be jumping on opportunities of a ceasefire en masse and would instead test the waters with ad-hoc voyages before making commitments. That said, we continue to investigate what the seascape might look like once Suez transits resume and keep our eyes open for any clues in the schedules.
At this time there are only 3 known new alliance service versions that will utilize the Suez Canal passage - Gemini’s MEA - MED bridge 1, 2, and 3 - all part of the smaller Europe - Middle East trade but not officially classified as Gemini shuttles.
Premier Alliance
- PMR - MD4 has one blank sailing in slot 2, impacting European ports in early-mid April.
- PMR - MD5 was initially thought to be standalone ONE based on a November 1 publication but YML and MSC’s participation were confirmed months later on January 26. The service is still under close observation to confirm if the current MSC operated vessel lineup persists into Q2.
- All Premier services except for the FE4, MD4, and MD5 were pushed back by a week in their start dates, with some being confirmed as late as the final week of January:
Gemini Cooperation
- GEM - Asia Med loop 3 remained tricky to nail down into the final weeks before commencement. It currently has 2 blank sailings in slot 5 and slot 9,and an advanced start date from February 8 to 1 that was confirmed in late January.
Non-Alliance
- MSC - Jade has 9 out of 15 slots that have definitive assignments, but there is plenty of flexibility here because the first 8 sailings are in place, accounting for voyages through early April.
- MSC - Albatros kicks off the first slot with a blank sailing and currently has the first 12 of 16 total slots defined.
Service examples: rotation comparisons
We take a look at what traits the virgin services of 2025 will assume from their predecessors, and how close of a likeness a namesake really entails. There are fewer namesakes carried over by Maersk Line into their Gemini partnership than we have seen in the East and West Coast North America analysis.
Due to the longer roundtrip of Far East - Europe services and the significant number of potential discharge ports across Europe, they host far more potential for route alterations than in the Far East - West Coast North America trade. The inclusion of MSC in all but one of the new Premier Alliance services in this trade also means we see some dual iterations of former 2M services, along with a rare case of an MSC standalone service becoming a new Premier rotation.
Broadly speaking, there are other noteworthy patterns such as Gemini services reducing port calls in Asia whilst Premier services tend to grow in size from their predecessors. Despite that growth, it’s important to speculate on the reasons for services like the FE5 dropping calls to key transhipment hubs like Tanjung Pelepas and Algeciars. These strategic port swaps provide plenty of material for discussing the evolution of schedule reliability over the next several months.
Premier Alliance
- PMR - FE5 carrying on from 2M - NEUR loop 5, note that Maersk Line does not offer a continuation of their AE6 through GEM: Slots increase by 2 and 13 of the 17 slots are occupied by MSC operated vessels from the former service. Roundtrip increases by 2 weeks up to 119 days and 6 calls are added. Qingdao, Busan, Nansha, Zeebruge, Hamburg, Rotterdam, a second Antwerp call, London Gateway, Abu Dhabi, Jebel Ali, and a second Yantian call are added. Tanjung, Sines, Felixstowe, Algeciras, and Laem Chabang are added.
- PMR - MD4 develops from the standalone MSC - Dragon and no alliance predecessor: 18 to 16 slots, 10 day reduction to 112 day roundtrip. Reduction in avg. vessel size from 35K to 33K TEU, no vessels currently deployed to the Dragon transfer over. Primary rotation changes occur on the Asian leg with Shanghai, Nansha, Vizhinjam, and a second Yantian call added. Dalian, Tianjin, Busan are dropped.
Gemini Cooperation
- GEM - Asia Med loop 2 carryover from 2M - MED loop (ML - AE11 namesake): No MSC operated vessels transfer over to Gemini from the 2M service and the average vessel size dips by 3K down to 28K TEU’s. Roundtrip dips by 2 weeks down to 91 days, 4 calls are dropped down to 12 and slots reduced to 13 total. Genoa, Vado Ligure, Tanger Med, and Tanjung Pelepas are added. Calls in Asia are significantly reduced to just Shanghai, Yantian, and Singapore.
- GEM - Asia Northern Europe loop 4 develops from 2M - NEUR loop 1 (ML - AE5 namesake): Roundtrip is reduced to 98 days, calls are reduced from 17 to 10, and vessel slots are reduced to 14. About half of the first round of deployments are transfers from the 2M service and average vessel size remains in the 18-19K TEU range. Qingdao, Yantian, London Gateway, Hamburg, Rotterdam, and a second call to Tanjung Pelepas are added. Dalian, Tianjin, Busan, Ningbo, both calls to Shanghai, Gothenburg, Aarhus, Wilhelmshaven, Tanger Med, and Singapore are dropped.
Non-Alliance
- MSC - Albatros takeover from the 2M - NEUR loop 1: transfers over none of the Maersk operated 2M vessels but sees no change in average 32K TEU. Roundtrip of 112 days and 16 total slots unchanged. Busan, Tanjung, Rotterdam, Gothenburg, Aarhus, Wilhelmshaven, Tanger Med, and a second Shanghai call are added. Kwangyang, Yantian, first Singapore call, Felixstowe calls, London Gateway, Gdansk, second Bremerhaven call, and Cai Mep are dropped.
- MSC - Jade offshoot from 2M - Med loop: 6 of the 9 available slots are direct MSC vessel transfers from the 2M service, Avg. TEU remains unchanged. 105 day roundtrip, total slots unchanged, and a fairly close rendition of the old rotation. Vizhinjam, Sines, and the second Shanghai call are added. Xiamen, Nansha, and the second Yantian call are removed.
Methodology notes
- Proforma events are planned calls that are based on service rotations provided by carrier fliers and long-term schedules. They are unique to each service version and measured as expected capacity. Changes to proforma schedules can be communicated by carriers on official channels but are not subject to individual voyages and ad-hoc vessel behavior.
- Actual events are calls that have already occurred and are reflected in our actual deployed capacity measurements. Some actual events do not have planned proforma schedules and are defined as inducements. Before an actual event has passed, it is classified as a forecasted event - distinct from proforma or expected capacity.
- Trade capacity and planned events on all counts in the analysis above were measured by the first port of discharge.
- When measuring trade capacity by trade, service, or alliance we prorate the values based on assumptions like 90% capacity being utilized at the last load port of the first leg of the journey. We also use this method to split the expected capacity for complex cargo flow services that call multiple regions in addition to the West Coast (ie Central America, East Coast North America).
- A last load port is the last call on the head haul of a cargo flow: on West Coast North America service rotations this will be defined by the final Asian port of call before the vessel sets out across the Pacific to North America. The first discharge port on the head haul is defined as the first port of call in the next leg of this cargo flow: that would be the first vessel’s first planned call in Canada or the United States.
Contact us: Please reach out to ops@eesea.com if you are an existing customer that would like to explore these stories in depth, contact@eesea.com if you are interested in collaborating on press releases or other third party publications, and commercial@eesea.com if you are a new user looking to test a use case and learn about what our data solutions can offer.
eeSea Signals
- Rotterdam Inbound/Outbound Calendar
- Hamburg Inbound/Outbound Calendar
- London Gateway Inbound/Outbound Calendar
- Antwerp Inbound/Outbound Calendar
- Le Havre Inbound/Outbound Calendar
- Algeciras Inbound/Outbound Calendar
- Barcelona Inbound/Outbound Calendar
- La Spezia Inbound/Outbound Calendar
- La Spezia Inbound/Outbound Calendar
- Genoa Inbound/Outbound Calendar
- Piraeus Inbound/Outbound Calendar
- Istanbul/Ambarli Inbound/Outbound Calendar
- Alexandria Inbound/Outbound Calendar
- Port Said Inbound/Outbound Calendar
- Suez Canal Inbound/Outbound Calendar
- Cape of Good Hope Inbound/Outbound Calendar
- All Current + Upcoming Premier Alliance Services
- All Current + Upcoming Asia - North America Gemini Cooperation Services
- All Current + Upcoming Ocean Alliance Services
- eeSea TrueTransit Global Port Connectivity + Reliability Benchmarking for Far East - West Coast North America Trade
- Trade Lane Dashboard Including Schedule Reliability and Actual vs. Expected Capacity Timeline - Tableau Permission Required
- Port Calendar Including Vessel Forecasts + Delays by Service - Tableau Permission Required
- Trade Capacity Index Changes by Service + Port - Tableau Permission Required
- VSA Shares by Trade + Service - Tableau Permission Required
- Alliance Reshuffle Weekly Capacity Changes by Alliance - Tableau Permission Required