

As we hinted last week, the sideways shuffle of global schedule reliability in 2025 should not be oversimplified as stability. With a comprehensive coverage of vessel arrivals across all global trades, it becomes clear that the reliability plateau of 2025 has been driven by the neutralizing effect of opposing forces.
The ongoing use of South Africa’s Cape of Good Hope as standard routing for Far East – Europe and the Middle East trades continued to put significant downward pressure on global reliability throughout the year. The introduction of Gemini’s amped up hub n’ spoke methodology on the other hand, served to boost reliability across all trades. On the Europe – North America trade, where the Gemini Cooperation maintains market share dominance alongside MSC, positive reliability was also aided by the more muted whiplash of tariff relations between the United States and European nations. On the Far East – North America trade, the impact of the Trump administration’s tariff wars with China were not restricted to swings in on-time arrivals and were laid bare in specific periods of heightened uncertainty.
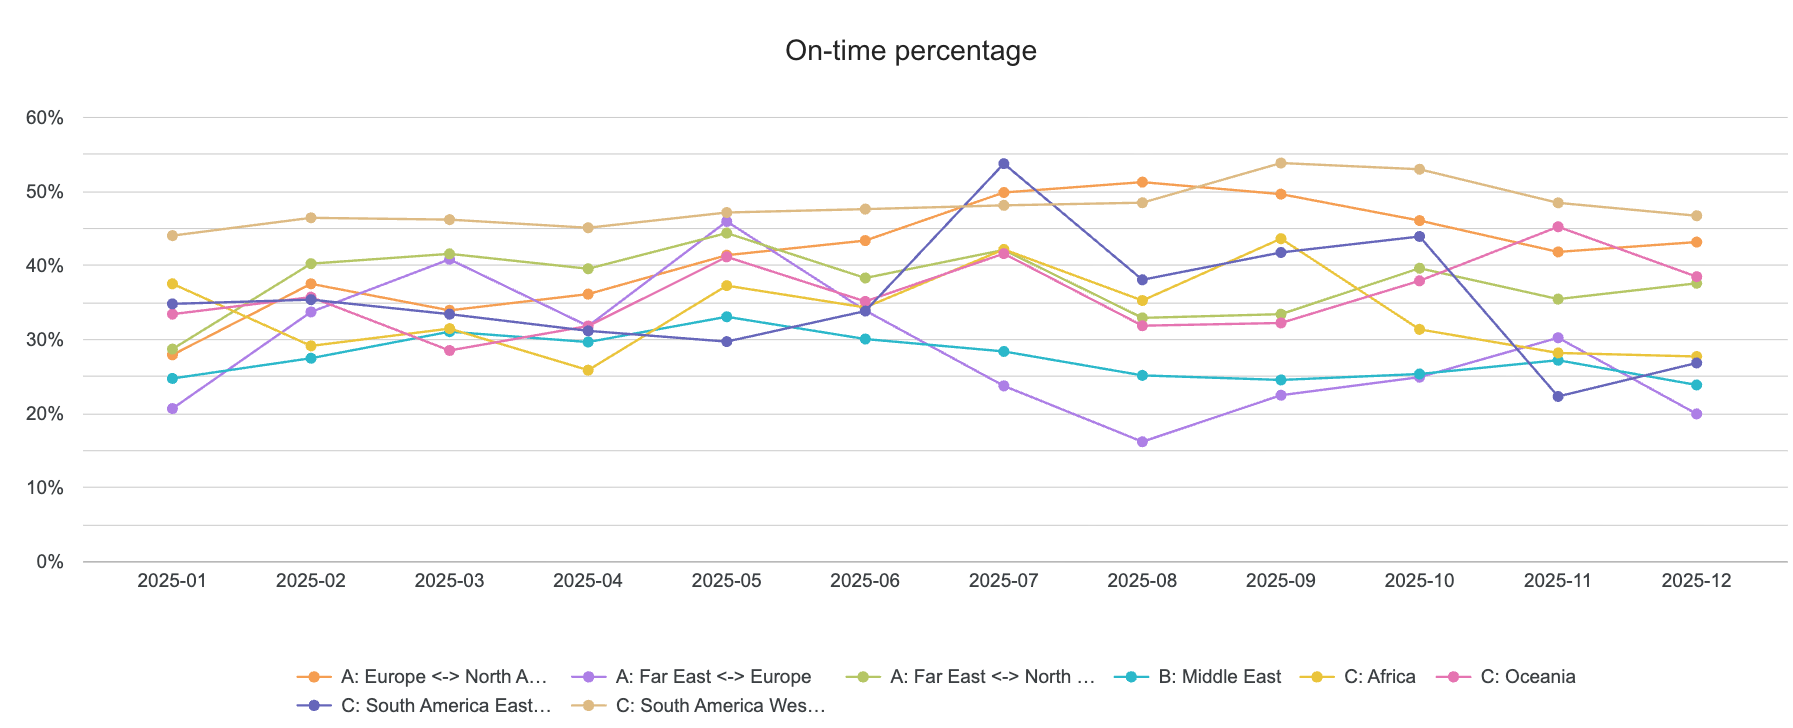
Monthly On-Time Arrivals by Trade, 2025
Monthly Delays by Trade, 2025

Let’s look at how these competitive tides have translated into reliability numbers across our best and worst performers by trade.
Average Yearly Reliability Ranked from Best to Worst
-
- West Coast South America (48% on-time, -2.2 days delayed)
-
- Europe - North America (42% on-time, -2.5 days delayed)
-
- Far East – North America (38% on-time, -2.8 days delayed)
-
- Oceania (36% on-time, -3.5 days delayed)
-
- East Coast South America (35% on-time, -4.0 days delayed)
-
- Africa (34% on-time, -3.3 days delayed)
-
- Far East – Europe (29% on-time, -3.8 days delayed)
-
- Middle East (28% on-time, -4.8 days delayed)
West Coast South America continued in the lead but was almost edged out by Europe - North Americas adavnatges this year. Far East - North America was not so far behind, and demonstrated the stabilizing push and pull of geopolitics and new alliance structures best of all. Oceania could be poised to overtake the transpacific if relations between Trump and China cool again in 2026, and East Coast South America fell far below its sister coast after being plagued by congestion troubles at key Brazilian ports throughout the year. Far East - Europe and the Middle East were the poorest performers, hardly surprising given the enormity of the Red Sea challenge and knock-on effect of poor reliability shadowing both trades since the start of 2024.
Q1 vs Q4 Progression
- West Coast South America gained 9% of on-time arrivals and reduced delay by 1.5 days
- Europe - North America gained 33% of on-time arrivals and reduced delay by 1.3 days
- Far East – North America stayed level with 0% change in on-time arrivals but reduced delay by 0.7 days
- Oceania gained 25% of on-time arrivals and reduced delay by 1.3 days East Coast South America lost 9% of on-time arrivals but reduced delay by 2.4 days
- Africa lost 12% of on-time arrivals and reduced delay by 0.3 days
- Far East – Europe lost 22% of on-time arrivals but reduced delay by 0.9 days
- Middle East lost 11% of on-time arrivals but reduced delays by 0.5 days
Quarterly comparisons at the start and close of 2025 illustrate how average days delayed and on-time percentage don't always share a 1:1 trajectory, nor does net improvement does equate to a superior ranking. A trade like the Middle East can experience less reliability loss than its peers but still end up at the bottom of the pack. Mirroring that principle, the improvement in on-time arrivals for West Coast South America was dwarfed by Europe – North America and Oceania, but it still retained that 1st place ranking held since 2023. In other words, it’s rarely just changes in the past quarter, or even the past year, that determine how a trade performs against peers overall. Success is additive, consistency is key, and resilience often outperforms bursts of progress.
Quarterly On-Time Arrivals by Trade, 2024 - 2025

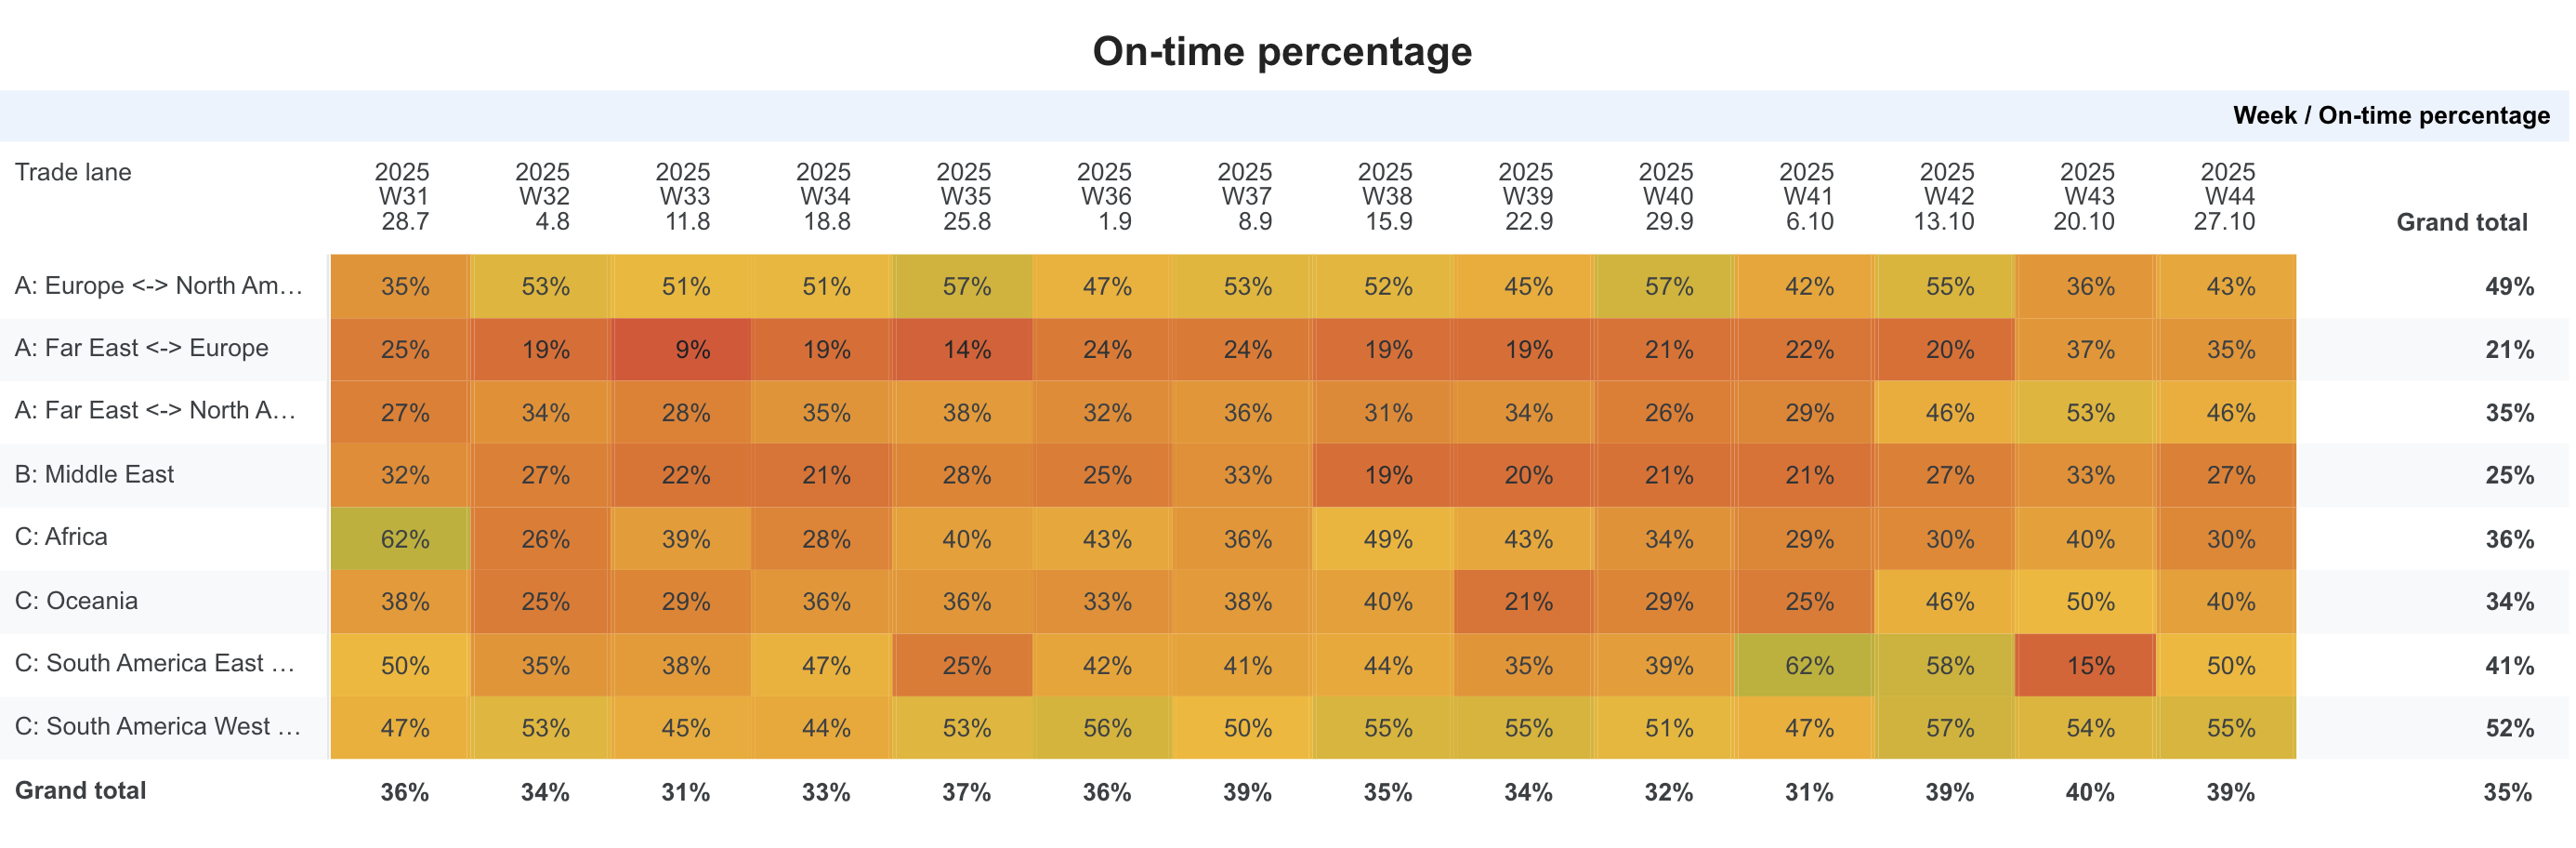
A brief look at the reliability impact of tariff uncertainties at a weekly scale reveals deeper pockets of concern than quarterly or monthly averages. Weekly on-time arrivals for Far East - North America averaged at 36% in Q3 but dipped as low as 26% on individual weeks. Even more telling as a measure of trouble between China and the United States was cancelled sailings.
The post-Chinese New Year period averaged at 41% on-time and doesn’t raise any alarms at the surface, but it serves well to demonstrate why we should diversify reliability measures as standard practice. We saw 163 total blanked voyages in March through May, with 61 in May alone exceeding the 59 Lunar New Year blanks of February. That amounts to a 43% increase against the number of blanks we saw in the same period in 2024. The rate of blank sailings did eventually return to normal levels by the summer, before giving way to poorer on-time performance.
Weekly On-Time Arrivals for Far East - North America, 2025
Up next we explore extreme divergences in the alliance and carrier performances of 2025, including how they compare by cancellation rate. If you’d like to read our past reliability reports, please visit our SRS publications page. To learn more about how Xeneta data can help you improve the resilience of your supply chain at critical moments, reach out to us at contact@xeneta.com