
Highlights
- Maersk retains the top spot in eeSea's Schedule Reliability Scorecard for 2025 Q1, with an on-time percentage of 45% - a spot they have held continuously since 2021 Q4
- Zim takes second spot, followed by Cosco in third; CMA CGM drops from second to fifth
- Hapag-Lloyd jumps from 8th in January to second in March 2025 - a monthly spot they have never held since eeSea started measuring in 2020
Overall ranking
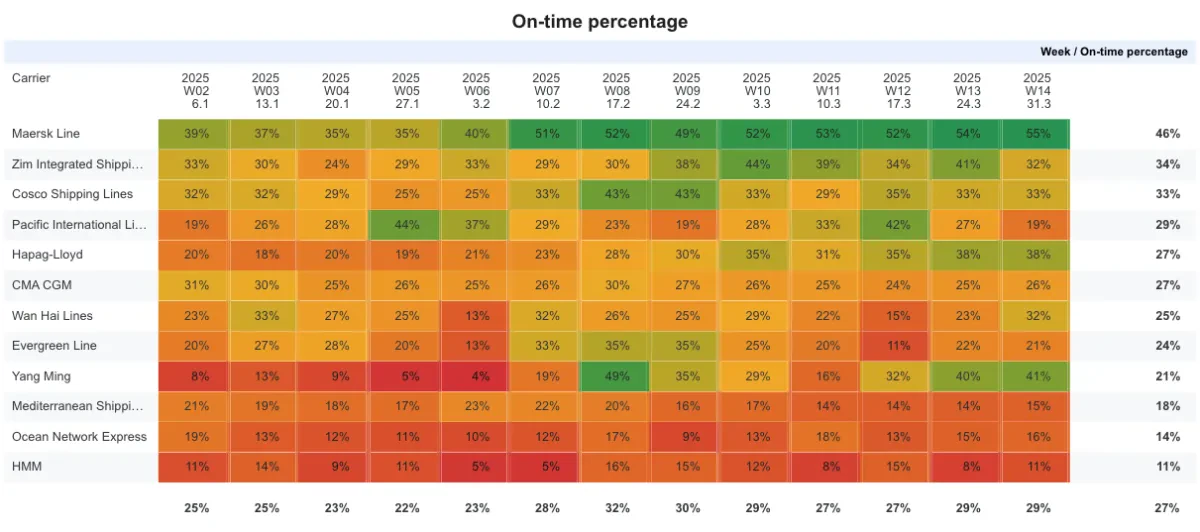
Maersk retains the no 1 spot in 2025 Q1, which they have held since 2021 Q4. The Copenhagen-based company scored a 45% OTP in Q1 overall, and 53% in March.
They were pipped to the top spot for four consecutive months from February through May 2024, when measured monthly. However, in Q1 2025 the gap to second place is again growing.
Zim takes second spot in Q1 (34%), followed by Cosco in third (32%). CMA CGM, who have been second in the last two quarterly rankings, drop to fifth (27%).
The race for second and third place, however, is crowded with 7 of the reported 12 carriers coming in between 18% and 30% in Q1. Hyundai finish bottom, at 10% OTP - having been in the bottom three since 2020 Q3.
Measuring by VSA partner, however, the more granular monthly developments paint a different trajectory. Hapag-Lloyd jumps from 20% OTP in January (8th place) to 37% in March (2nd), ahead of Zim (34%) and CMA (28.2%) and Wan Hai (28.0%).
You can follow the quarterly, monthly, and weekly developments live here. Remember to adjust the filters.
 Quarterly carrier OTP ranking since 2020, per vessel operator
Hapag and Maersk's split personalities
Earlier this week we announced how Gemini recorded an average Q1 OTP of 86%. How can Hapag-Lloyd and Maersk record individual OTPs of 28% and 43% in Q1, then ?
The answer is that both partners record reliability outside their cooperation, of course. Maersk is still transitioning out of 2M, and Hapag-Lloyd out of THEA - both of these expiring alliances weighing heavily on their overall performance.
And, even after those two alliances are gone, either carrier will be participating - and competing fiercely - in trades outside the Gemini Cooperation, namely Oceania, Africa, and Latin America.
In Q1 both carriers saw about 12% of the port calls they participated in globally come under the Gemini umbrella; in Q2 that will have increased to 32%. If they continue the positive reliability performance under Gemini, and as 2M and THEA finally phase fully out, that will of course positively impact their overall numbers.
 Hapag-Lloyd and Maersk number of port calls split by alliance, measured as VSA partners
The same trends described above are relevant for the other carriers as well; albeit with a smaller gap between their current alliance performance and their individual carrier performances.
Other eeSea resources
As we continue to improve the eeSea platform and this Schedule Reliability Scorecard, we are making the above referenced insights available through interactive and continuously updated dashboards. There are several links above; and the full collection of dashboards can be found here.
You can sign up for a 14-day trial at app.eesea.com/register - and thereafter find the dashboards under 'Insights' in the left-hand menu. For detailed analysis, you are most welcome to reach out to contact@eesea.com.
Methodology
eeSea's primary reliability measure is the on-time percentage (OTP; within 24 hrs of scheduled proforma arrival). The insights can also be viewed by average delay (counting early arrivals as zero delay).
We report equally on weekly, monthly, quarterly and annual developments - it is always mentioned how the number and rank is derived.
Comments on the carriers are mainly made through the lens of the vessels they operate. However, it would be equally pertinent for eg shippers and cargo owners to consider the alternative metric; measuring by the services on which a carrier participates (regardless of whether they provide vessels or not); in our dashboards you can see this under Participation type = 'VSA partner'.
Finally, we focus the carrier reliability on the main East/West and North/South trades. These include trades between Asia, Europe, North America, Oceania, Africa and Latin America, but exclude feeders and intraregional services.