
Earlier this year, we examined the recurring congestion that led to several services diverting from London Gateway, including Maersk’s Neo Samba and ONE’s Indian Ocean Express. The port has faced several challenges on top of the existing post-Red Sea crisis strain affecting major Northern European ports. These additional disruptions have also highlighted the competitive positioning of sister ports Southampton and Felixstowe, although neither are exempt from reliability issues of their own. Today we look back at the lingering effects of those challenges, including capacity lost and reliability regained.
The Setup
One contributor that may have exacerbated issues at London Gateway is construction on DP World’s $1.3 billion berth expansion project, underway since May 2025. This massive investment will ensure an additional 450,000 TEU of yearly handling capacity when it’s completed in 2030. Until then, factors like reduced working areas will necessitate some negative impacts on reliability and capacity, as mega construction projects can be expected to do.
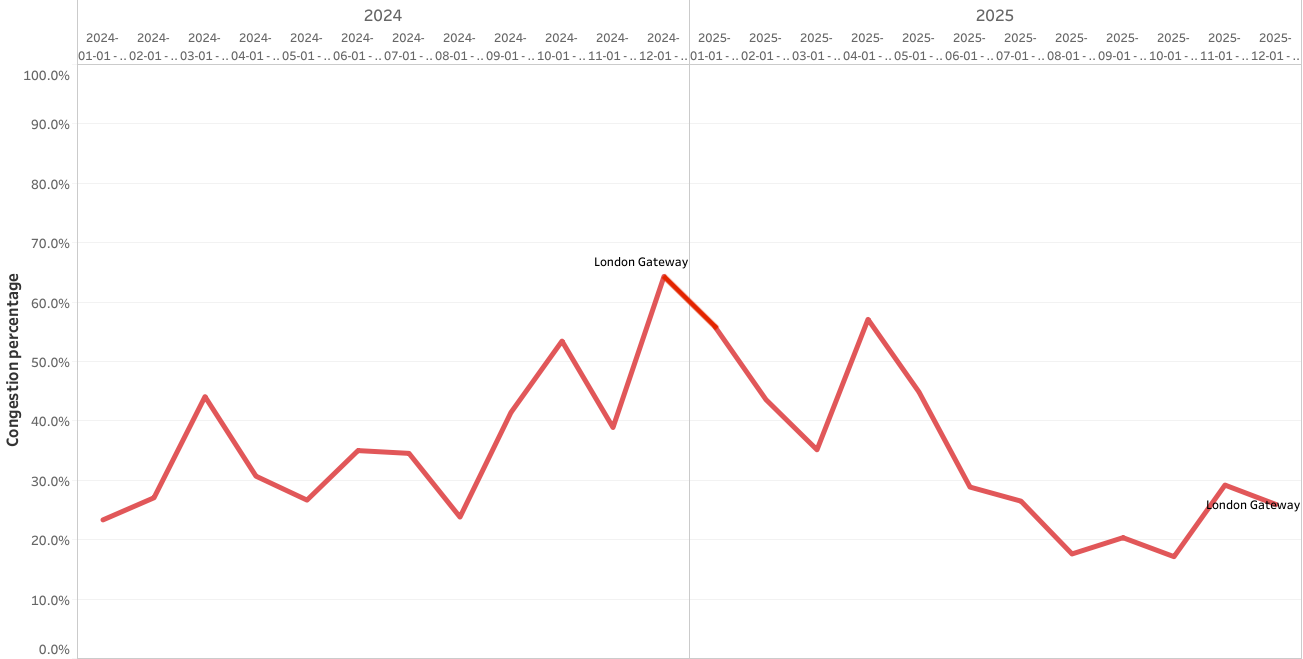
With Asia-Europe services making longer voyages past the Cape of Good Hope and their larger vessels requiring increased handling times, it’s no surprise that London Gateway’s average congestion was already soaring between 40-60% from Q3 2024 through February 2025. When monthly congestion peaked at 57% in April and construction on the berth expansion began, it added further strain on vessel wait times. Then in June and July, a series of IT and power outages, along with a rail incident, led to a massive container backlog.
Average monthly congestion at London Gateway - 2025
The Relief
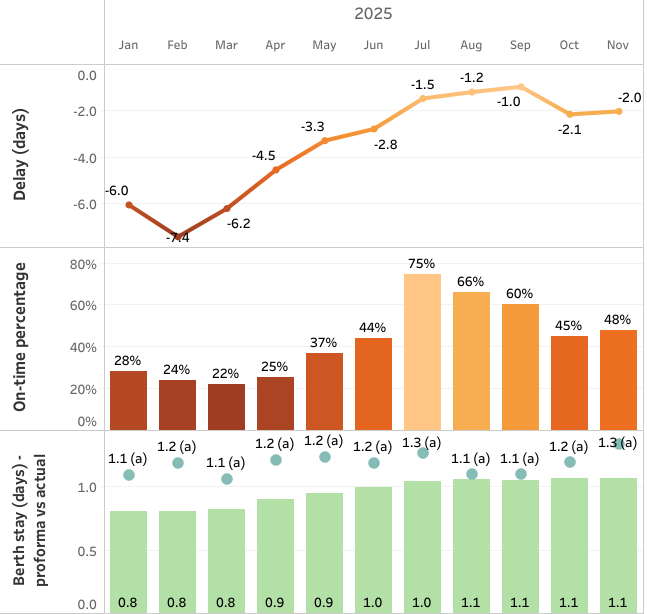
It may seem counterintuitive, but this led to an immediate respite in poor reliability. On-time percentage jumped from 44% in June to 75% in July, and delays decreased from an average –2.8 to –1.5 days delayed. This improved reliability was sustained throughout Q3 before dropping back down to 45% of on-time arrivals in October, and has remained below 50% since. How can a struggling port experience a dramatic resurgence in reliability? The reason reveals the complexity of relationships between reliability, capacity, and congestion - and why nothing should be taken at face value. So many services were quick to scale back and omit calls to London Gateway that it provided immediate relief to these back-to-back disruptions, but at a huge cost.
Schedule reliability evolution at London Gateway - 2025
 *Note: Displayed values in this static image are limited to actual capacity represented by bars, while the line represents expected capacity.
The Cost
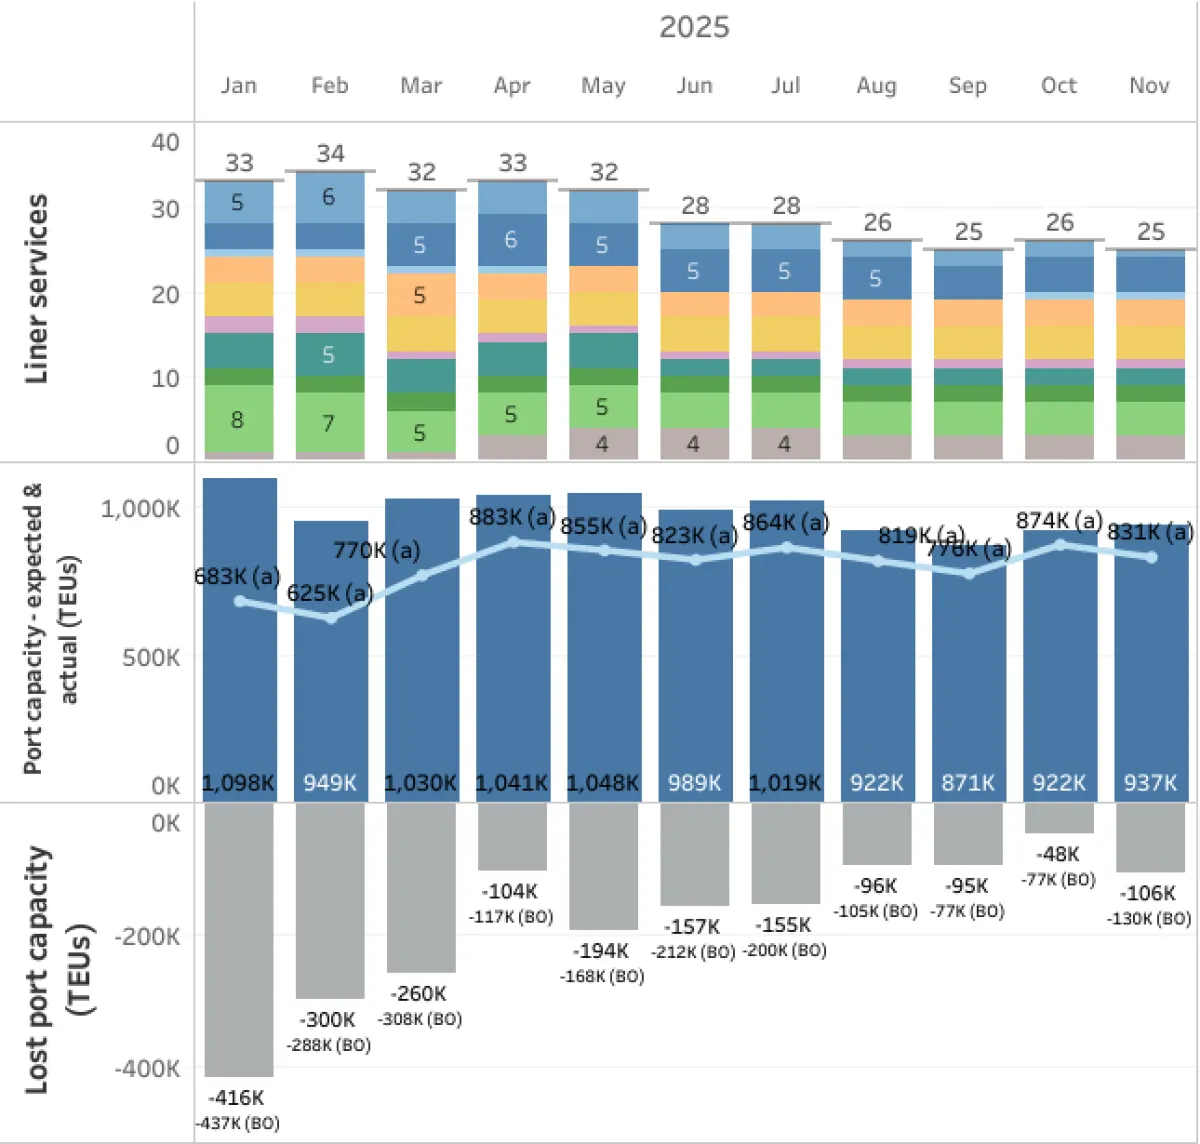
London Gateway has suffered 2 million TEU’s of absolute lost capacity year-to-date. That’s a sizeable 58% increase against 2024, and a stunning 480% increase in lost capacity against 2023. Comparing that to the year-over-year expected capacity growth of +11% in 2024, and +18% in 2025, we can illustrate just how rapidly these losses outpaced the rate of growth. If we go ahead and discount ‘gains’ like month-over-month rolling vessel delays and inducements (aka unplanned calls), the port racked up 2.16 million TEU’s of capacity due to omissions alone in 2025.
Trade capacity index (TCI) at London Gateway - 2025

Service Impacts
While many London Gateway services rerouted to Southampton or Felixstowe in short bursts during the height of delays, others have extended what initially began as temporary rotation adjustments well into 2026. From May through December, structural service changes have contributed to a decline from 32 to 25 strings, or 28% of the port's services. The reason we avoid including Q1 in this calculation is that the combination of old and new alliance services operating simultaneously during the turnover period would unfairly skew this decline in an even more negative light.
Some services like MSC’s Middle East IPAK string cleverly maintain both Felixstowe and London Gateway calls in order to diversify options and mitigate risks. But strategies can range even for the same carrier; MSC’s West Africa NWC MOR WAF service has omitted calls to London Gateway a total of 25 times in the past year and continues to do so on a regular basis. These measures are being taken despite the port still holding a key position in the string's rotation as the first port of discharge.
Services with updated rotations include:
- HMM - INX | ONE - IOX | YML - ISE dropped London Gateway from schedules in June, before planned calls ever came to fruition.
- CMA – SAFRAN | ML - Neo Samba has seen several advisories from both CMA CGM and Maersk diverting the proforma rotation to Southampton, the most recent advisory being issued December 01.
- COSCO - ESE2 | ONE - LUX | OOCL - EEX Replaced London Gateway calls with Felixstowe following 8 omissions from January through June.
- PMR - FE5 || HMM - FE5 | MSC - Lion | ONE - FE5 | YML - FE5 dropped London Gateway after service version 1 finished phasing out in October.
- HL – CES | ML – TA5 replaced London Gateway with Felixstowe as the first port of discharge with version 17, beginning in May.
- MSC - Albatros is a standalone RTW service where London Gateway was paired with an existing Felixstowe call in August. It has since been enhanced with a second Felixstowe call in service version 4. There have already been 7 omissions to London Gateway in the past 3 months, and just 3 to Felixstowe in early summer.
The Competition
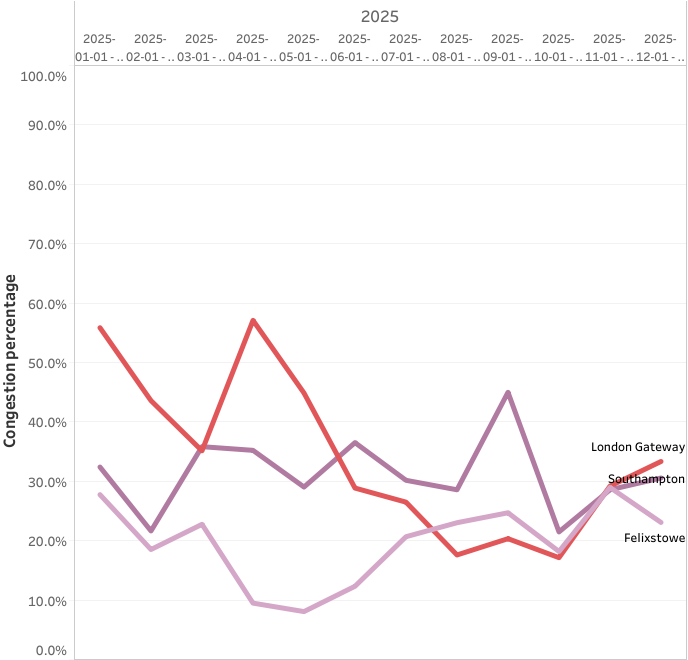
We have often observed the phenomenon of congestion and delays hitting neighboring ports that function as diversion agents in shared coastal areas. Southampton was no exception this year, but Felixstowe fared better. From March through September, Southampton sustained average monthly congestion levels above 28% and peaked at 45%; a far cry from yearly average of 22% congestion in 2024. Felixstowe, which has the advantage of size and greater handling capacity, has generally avoided elevated levels in 2025. We saw exceptionally low average congestion remain under 12% throughout Q2 but did witness a recent peak to 29% in November.
Average monthly congestion at major UK ports - 2025
Collateral congestion aside, Southampton could very well attribute some diverted traffic to their throughput growth this year. Felixstowe’s actual capacity has seen a modest 3% YoY growth, compared to a 5% increase in 2024. Southampton however, has seen a very notable 29% growth in actual capacity so far, compared to a -3% YoY decline in 2024. The reason we default to actual instead of expected capacity here, is that it enables us to include capacity delivered via inducement calls. If we look at how these three measure up in terms of planned port calls; London Gateway lost 22% of expected port calls, Southampton lost 11%, and Felixstowe lost just 3% of expected arrivals.
Total expected + lost capacity at major UK ports - 2023, 2024, 2025
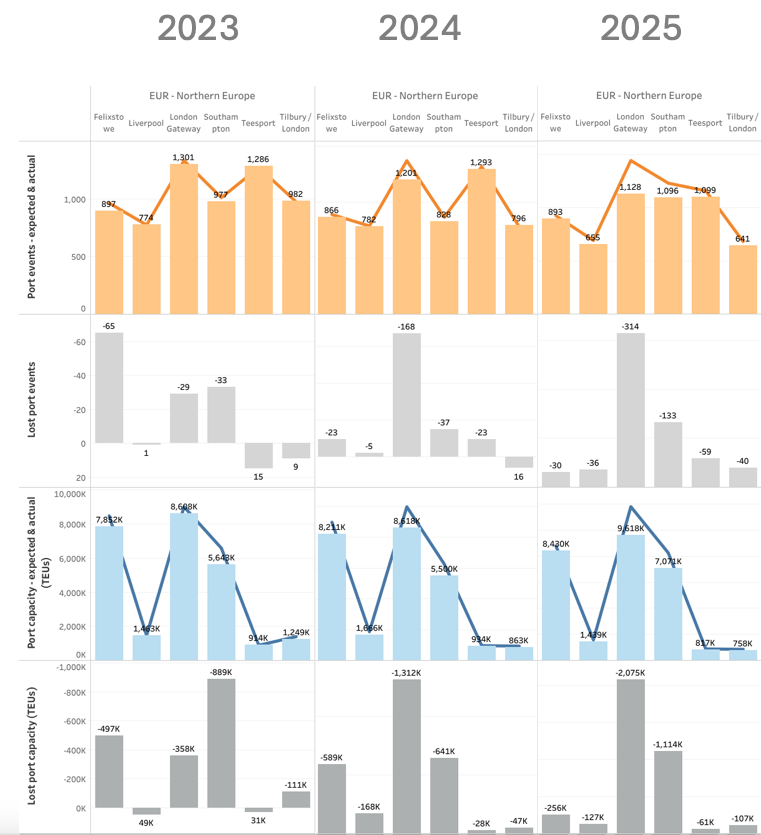
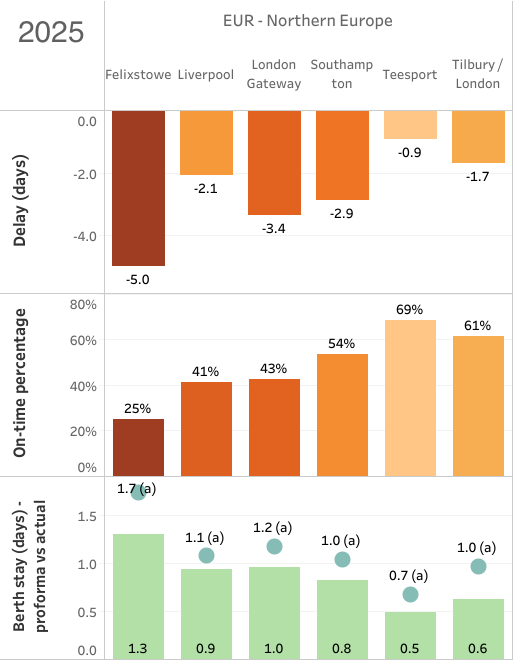
As we've seen, relationships between key metrics are rarely a 1:1 tradeoff. Felixstowe may have the lowest number of lost port events and least congestion, but average YTD values show delays are still at –5 days delayed and just 25% of vessels arrive on time. London Gateway approaches –3.4 days of average delay and 43% of on-time arrivals, while Southampton averages –2.9 days of delay and achieves 54% on-time arrivals. These yearly averages track against last year’s results, with Felixstowe (-4.4 days delay, 25% OTP) still characterized by the poorest reliability, London Gateway (-3.8 days delay, 33% OTP) revealing some muted improvement thanks to reduced traffic, and Southampton (-3.1 days delay, 54%) demonstrating resilience.
Average reliability at major UK ports - Year-to-date, 2025
The Takeaway
Even when short-term operational challenges are reduced and reliability is stabilized, business as usual does not always resume in short order. Confidence lost can reap long-term effects, and reliability can be easily redisrupted when traffic picks up or other stressors appear.
We must make it standard practice to illustrate the nuanced relationships of reliability metrics if we want to get ahead of impacts to our supply chains. This understanding is crucial to finding the right balance of risk and opportunity, and framing the tradeoff between cost and reliability.
If we approach our findings in a holistic way, pairing positive advantages and negative risk factors, this is how UK ports shape up at a high-level from the perspective of a shipper or freight forwarder:
-
London Gateway has the highest handling capacity and the most diverse global port connectivity with 104 unique port connections, including the most African trade connections with 18 ports. The dedicated Gemini Cooperation partnership on the Asia – Europe trade ensures maximum reliability on the most volatile trade. Cancellation rates remain high, and congestion stressors display quick impact. Coupled with the ongoing expansion project, moderate but prolonged risks are balanced against strategic value.
-
Felixstowe is less subject to high cancellation rates and volatile congestion but hosts the most extreme delays. The fact that it hosts the highest concentration of Asia – Europe services, with all of them belonging to delay-stricken Ocean and Premier alliances, suggests reliability issues may be more service-centric than due to portside operations. With a total of 81 unique port connections, including 17 in Asia and 19 in North America, strategic E/W trade advantages are firmly juxtaposed against high delays.
-
Southampton has the highest concentration of Europe - North America services, with 28 out of a total of 83 global connections. It also benefits from Gemini partnership on this trade – a double win for reliability. Due to its smaller size, it can display more volatile congestion patterns and may be subject to the highest vessel wait times when issues do arise. This port is the longest distance of the three from feeder hub Tilbury and its smaller number of dedicated feeder strings should be considered. Moderate cancellation rates and reliability pose big advantages for long-term planning.
If you're ancticipating structural changes at a key port or already suffering from persistent shipment delays, ask your service providers what their Plan B and Plan C is. At Xeneta, we can help you assess if those plans are setting you up for success, or simply managing risks that are already at your doorstep. Reach out to our team today for smarter, faster, and more confident decision-making when it matters most. contact@xeneta.com
eeSea Signals
- All Port Pairs + Schedule Reliability Between Far East - United Kingdom
- All Port Pairs + Schedule Reliability Between North America - United Kingdom
- All Services Calling London Gateway
- London Gateway Inbound/Outbound Calendar
- London Gateway Trade Capacity Index (TCI) and Schedule Reliability Timeline - Tableau Permission Required
- Monthly Traffic + Omissions at London Gateway - Tableau Permission Required
- Average Weekly Congestion Timeline - Tableau Permission Required